
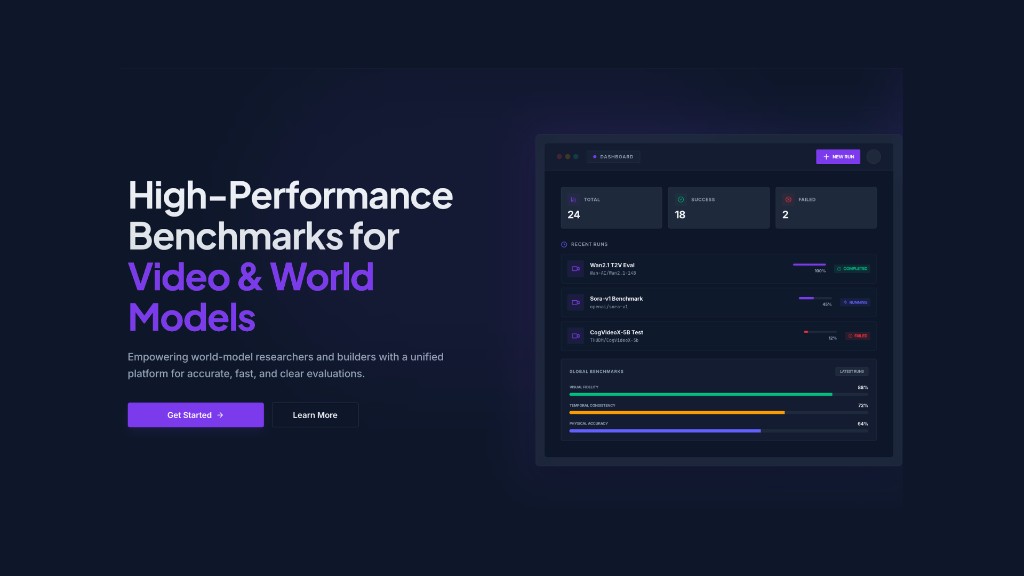
Introducing WorldJen: High-Performance Benchmarks for Video & World Models
TL;DR
- Try it now: worldjen.com
- WorldJen benchmarks generative video models end to end, from prompt curation to generation, VLM-based evaluation, and final scoring.
- It focuses on overlapping, realistic prompt coverage across multiple dimensions instead of narrow specialist prompts.
- It is designed to improve benchmark reliability while reducing the total cost of commercial video model evaluation.
Seeing is no longer believing!
Generative video models have successfully transitioned from academic prototypes to real-time consumer-facing applications for creative content, robot learning, and world model building. The general belief is that the demand for models with better quality, more features, and support for different modalities fuels further research and innovation, leading to better models over time. But what is “better”? And how does one measure it?
Traditional computer vision used reference-based metrics such as SSIM, PSNR, LPIPS, and FVMD that require a ground truth to compare against. As a general rule of thumb, generative media does not have a reference. When a user prompts for “a dragon in super man outfit flying over mars,” there is no real-world video to compare to. PSNR and SSIM observe pixel-level noise and structural overlap, which AI models can game by producing blurry but mathematically close pixels.[1] (For example, PSNR and SSIM will not tell you if the dragon has five wings, or if fire comes out of its tail. LPIPS, on the other hand, operates on a per-frame basis, which is better for capturing human perception, but it still misses the temporal components in the video.) FVD measures how natural the data looks by comparing the statistical distribution of generated clips to a dataset of real clips. This biases style over substance, and in particular rewards textures that look like training data; a model can game this by mimicking the look of a movie while objectively failing in physics.
VBench 1.0 is one of the first benchmarking tools credited with breaking quality measurement into dimensions such as aesthetics and motion. It relied on superficial faithfulness based on traditional metrics as well as image feature embedding tools such as DINO, CLIP, and RAFT. As such it misses temporal features that are intrinsic to video models. Nevertheless, it is still quite popular in academic and industry circles despite inconsistent results.
VBench 2.0 introduces intrinsic faithfulness that extends beyond per-frame quality. It uses generalist VLMs and LLMs to perform Video VQA (Visual Question Answering) to answer binary questions suited for different dimensions. While LLMs and VLMs have shown significant improvement in visual understanding, it is still very easy to bias the system to get specific answers.[2] (“When a measure becomes a target, it ceases to be a good measure” is an adage that follows from Goodhart’s law for statistical measurements.) Some of the potential problems in VBench are:
- The auditor model, LLaVA-Video-7B, has a much lower resolution capability than the video model being audited, which often makes the auditor blind to micro flickering.
- The VQA approach is prone to yes-bias. If you ask a VLM, “Is the physics correct?” it often defaults to “Yes” unless there is a catastrophic failure. It lacks the forensic reasoning needed to find subtle violations.
- The test prompts are tailored to specific dimensions in order to probe each dimension in a disentangled way.
- Generally speaking, realistic prompts and images entered by users are quite complex and usually overlap across multiple dimensions. Thus the typical points of failure are rarely tested, since the benchmark is mostly focused on model validation rather than exposing failure points.
Moreover, in a typical video benchmarking setup, video generation is the major cost. If one needs to generate several videos to get statistical significance in each dimension, it increases the number of videos generated significantly. Thus it is vital to improve the quality and reliability of video benchmarking, as well as reduce video generation costs, to make generative video AI viable for commercial products.
WorldJen
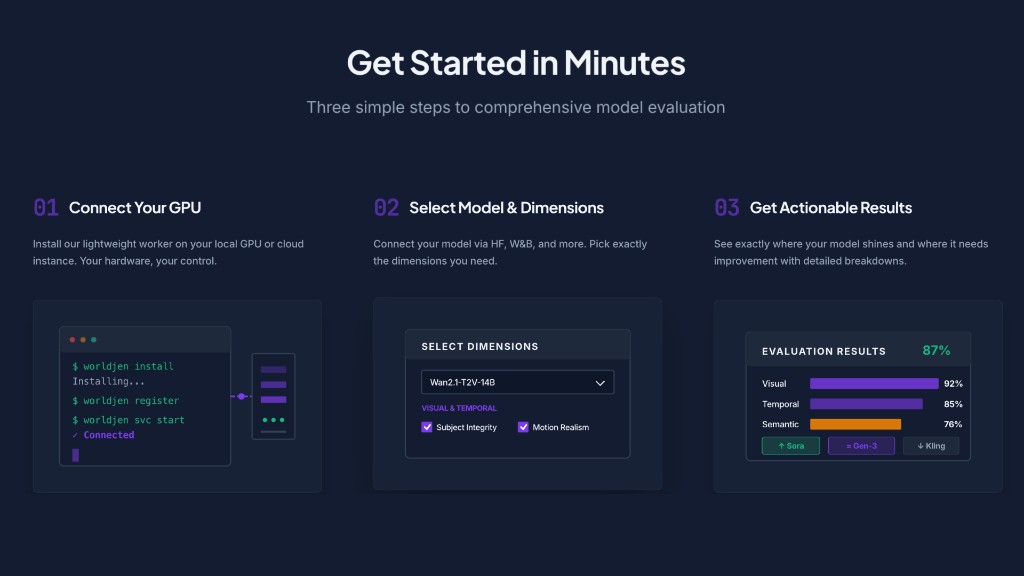
WorldJen handles the end-to-end workflow by:
- Choosing prompts from a curated dataset that are suitable for testing quality in the relevant dimensions.
- Generating the videos locally for the relevant prompts, and sending them to the WorldJen server for analysis.
- Analyzing the videos using a VLM system and prompt-specific, dimension-specific questionnaires.
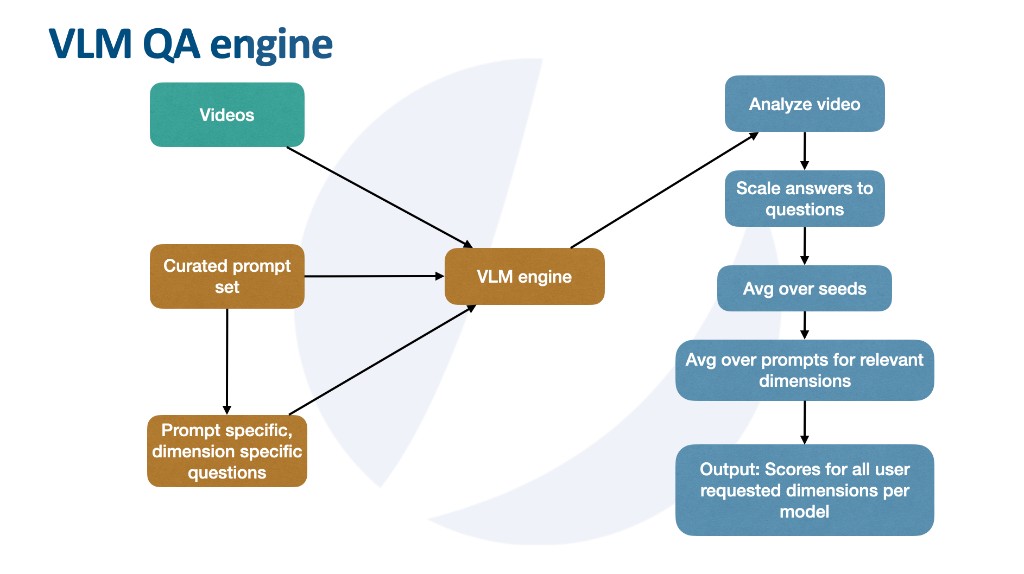
At a high level, the VLM system has the following structure:
- A curated prompt set where each prompt in general covers several dimensions for video benchmarking.
- A prompt-specific, dimension-specific questionnaire pre-generated by an LLM. In particular, generic questions are forbidden.
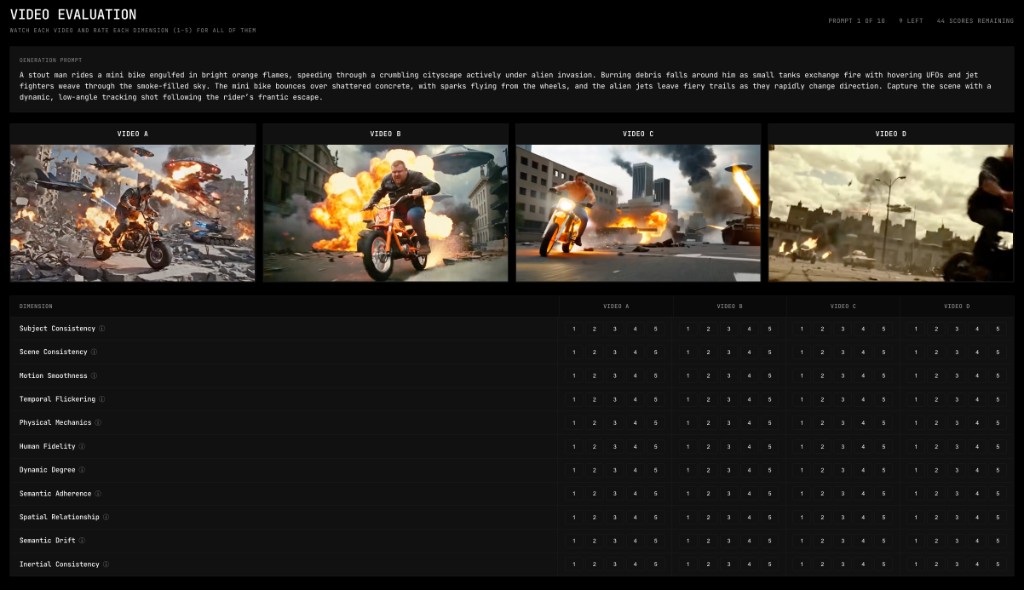
- A VLM engine that analyzes the video and rates each question on a 1 to 5 Likert scale.
- A scoring system that averages dimension scores over the number of seeds and prompts for the model being tested.
Benchmark Dimensions
Dimensions are a classification of attributes that a video model can be evaluated on. The grouping of the dimensions below is based on categorizing analysis in terms of how the video looks, how things move in the video, and whether the model is good at following instructions.
| Dimension | Group | Description |
|---|---|---|
| Subject Consistency | A: Motion & Stability | Main character/object maintains consistent shape, color and identity throughout the video |
| Scene Consistency | A: Motion & Stability | Environment stability without warping or melting during motion/camera |
| Motion Smoothness | A: Motion & Stability | Fluid stutterless motion, without jitter or frame skipping |
| Temporal Flickering | A: Motion & Stability | Lighting and texture stability, without unwanted flashes or brightness changes |
| Inertial Consistency | A: Motion & Stability | Objects follow momentum laws with natural acceleration and deceleration |
| Physical Mechanics | B: Logic & Physics | Gravity, friction, collision behave consistently with the laws of physics |
| Human Fidelity | B: Logic & Physics | Humans rendered without anatomical artifacts |
| Dynamic Degree | B: Logic & Physics | Actual object/character motion: not just camera movement or static scene |
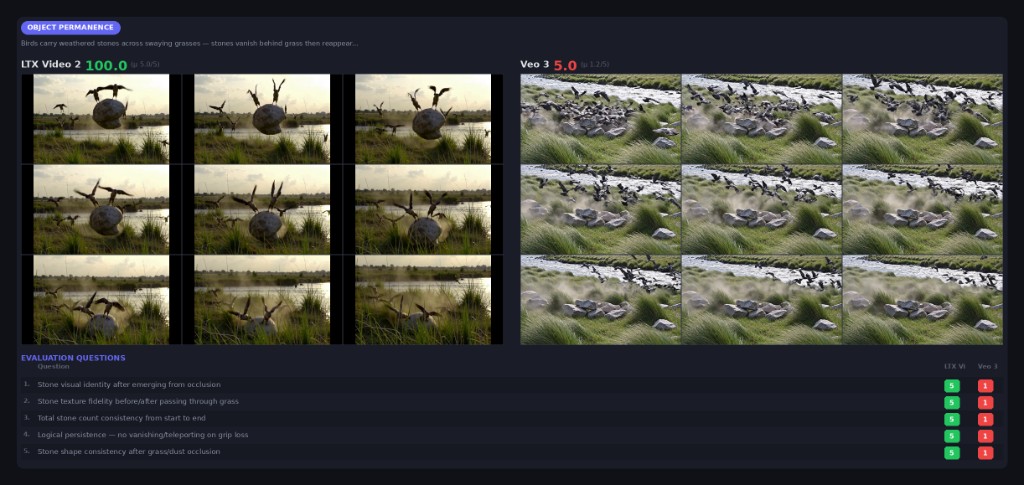
| Object Permanence | B: Logic & Physics | Objects maintain identity and appearance when reappearing after occlusion |
| Semantic Adherence | C: Instruction Adherence | Video contains exactly what was requested with correct attributes |
| Spatial Relationship | C: Instruction Adherence | Objects positioned correctly relative to each other as specified in the prompt |
| Semantic Drift | C: Instruction Adherence | Video deviation from prompt concept |
Prompt Curation
We source our prompts from the VidProm dataset, a collection of approximately 1.7M human-written video generation prompts. Human-authored prompts offer high entropy and diverse coverage across dimensions, but equally come with toxic, duplicate, and low-quality content.
We apply VidProm’s built-in filtering to remove NSFW, obscene, hateful, and offensive content, followed by deduplication (exact hash and MinHash/LSH), length and complexity filters, blacklist removal (URLs, political, controversial, famous persons), and spam filtering. A complexity score prioritizes prompts that involve physics, interactions, temporal events, multi-subject scenes, and spatial relationships, the kinds of content that stress-test video models.
This aggressive pre-filtering retains about 5,000 prompts, roughly 0.3% of the original dataset.
Prompt Scoring and Enhancement
Following the basic filtering process, we use an LLM to score the prompts based on the dimensions defined above. We define a system prompt that takes as input the definition of the dimension and does two types of scoring: suitability for the dimension and difficulty for the dimension, both on a scale of 1 to 10.
A simple analysis of the resulting scores shows that the spread across dimensions is good, and it is easy to find groups of prompts that cover multiple dimensions. During the scoring process, the LLM’s internal filtering process further deemed another 1,000 prompts unsuitable due to copyright issues, which we decided to skip as well. Furthermore, some prompts were manually removed due to code injection content and veiled statements. The final number of unique prompts amounts to 3,754.
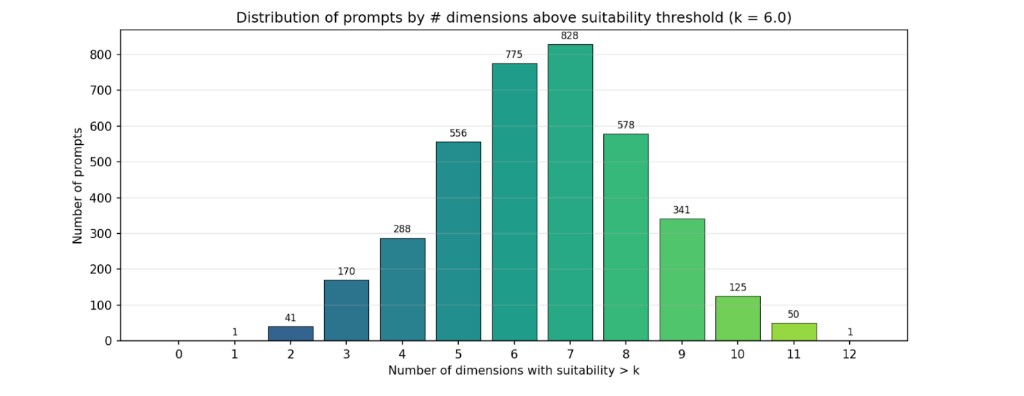
To analyze the dimensional coverage of our prompt set, we define a suitability threshold, for example 6.0, and count how many dimensions each prompt exceeds that threshold on. Before enhancement, most prompts cover only 3 to 6 dimensions, with the distribution concentrated toward fewer overlapping dimensions. Prompts that do not meet the threshold on any dimension fall into the discard pile, the 0 bin.
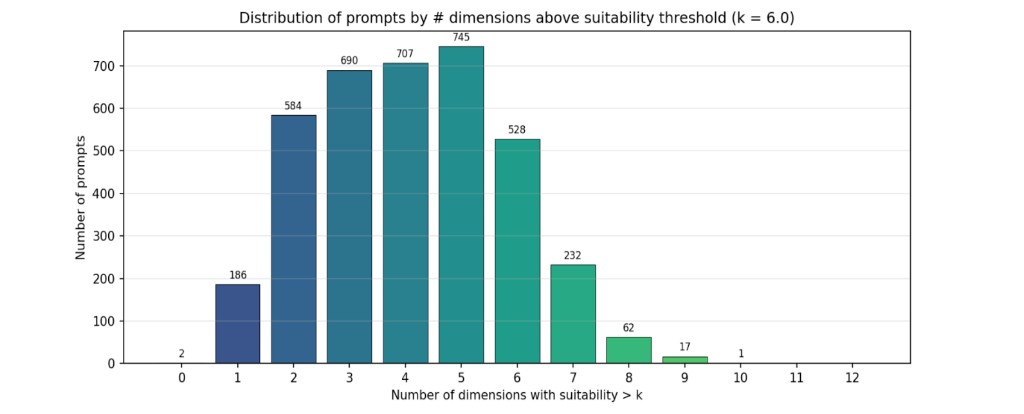
Since we would like to minimize such specialist prompts in the sampling process, we use an LLM to identify dimension weaknesses with suitability below 7, and enhance prompts in a dimension-specific way while preserving their core theme. We further use the LLM to clean up language and grammar for easier processing by video models. Following the enhancement, we rescore with the same LLM to validate the improvement. We find that there is an improvement in the average suitability and difficulty scores per dimension.
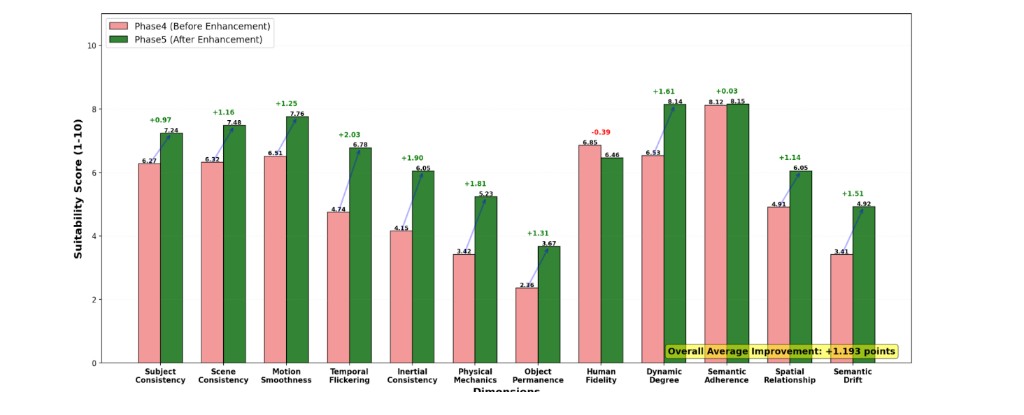
After rescoring we also find that prompts have a good spread over multiple dimensions with a nearly Gaussian distribution for a target suitability of 6.0 on average[3] (That is, we are looking for overlapping dimensions in the prompt dataset that cover roughly half the number of dimensions with an average score of 6.0.). Note that the good sampling range has an overlap of about 5 to 8 dimensions, thus increasing the sampling space with a spread over multiple dimensions, which gives us flexibility to sample differently depending on user requirements. Moreover, squeezing too many dimensions into one prompt can confuse video models and lead them to ignore parts of the prompt.
Our final prompt list consists of 3,754 unique prompts, with spread and overlap across multiple dimensions.
Question Generation
Once we have the curated prompt set, the next step is to generate dimension-specific evaluation questions for each prompt. The goal is to produce questions that the VLM evaluator can answer on a granular 1 to 5 Likert scale while watching a generated video.
We use an LLM to generate 10 evaluation questions per prompt and per dimension. Each question targets a specific item from a coverage checklist defined for the dimension, ensuring that the question set for a single prompt covers the full breadth of what that dimension tests.
The generation prompt is structured as follows:
- Context: The original video prompt and the target dimension definition, including scope, exclusions, and focus areas.
- Scale anchors: Concrete descriptions of what a score of 5, perfect, and 1, failure, look like for this dimension.
- Coverage checklist: Each question must target a different item specific to the given dimension.
- Difficulty distribution: Each question set spans three tiers: foundational checks that most competent models should pass, discriminative questions that separate good models from average ones, and demanding edge cases that only top-tier models handle well.
- Format variety: At least four different question structures like consistency ratings, quality ratings, and severity assessments.
Example
For the prompt “A hyperrealistic slow-motion shot of a basketball player dunking, with camera zooming in... sweat reflecting arena lights...” evaluated on Subject Consistency, the generator produces:
- Rate the consistency of the basketball player's facial identity from the beginning of the leap to the completion of the dunk.
- Rate the stability of the basketball jersey's colors and design patterns as the player moves through the air and the camera zooms in.
- Rate the consistency of the player's physical scale relative to the basketball and rim throughout the approach, dunk, and landing.
Note that, so far, what we have done is entirely based on prompts and dimensions, and does not assume any specific VLM capabilities. However, it is important that the VLM has a state-of-the-art text embedder and video feature recognition capabilities. Many open-source VLMs fall short in this category.
Scoring System
For each dimension, the raw 1 to 5 ratings are linearly mapped to a 0 to 100 score based on the mean rating across all questions. These per-dimension scores are then averaged across multiple seed videos for the same prompt to reduce variance from the generation process. The final model score for a dimension is simply the average across all prompts and seeds.
Video Analysis
Dimension question sets are processed in VLM calls including the video. Depending on the run configuration and the dimensions being evaluated, we can adjust frame sample rate, video resolution, and other parameters to get the best results[4] (For example, dimensions like temporal flickering benefit from a 1:1 sample rate and lower resolution, while scene consistency requires higher resolution.). The goal is to give the VLM enough information for its feature extractor to get a good response to the question, while not overwhelming it.
ELO Ratings
To extend absolute scores, we derive Elo ratings from the question-level Likert results between models. If model A scores higher than model B on a given question, A wins that matchup; if they score equally, it is a tie; otherwise B wins. These derived matchups feed into a Bradley-Terry model to produce Elo ratings per model, both overall and per dimension.
Sample Scores
In a recent evaluation across six models and approximately 163K question-level matchups, the Elo ratings derived from Likert scores produce the following overall ranking:
| Model | ELO | Best Dimension | Worst Dimension |
|---|---|---|---|
| Veo 3.1 | 1552 | Object Permanence (1663) | Temporal Flickering (1510) |
| Wan 2.2 14B | 1539 | Subject Consistency (1585) | Temporal Flickering (1436) |
| Kling 2.6 Pro | 1525 | Physical Mechanics (1587) | Scene Consistency (1483) |
| Hunyuan Video 1.5 | 1481 | Human Fidelity (1548) | Dynamic Degree (1427) |
| p-video | 1464 | Human Fidelity (1524) | Semantic Adherence (1362) |
| LTX2 19B | 1439 | Spatial Relationship (1491) | Dynamic Degree (1391) |
The per-dimension breakdown reveals that overall rankings do not tell the full story. Hunyuan Video 1.5 outperforms Kling 2.6 Pro on Human Fidelity despite ranking lower overall, and Wan 2.2 14B leads on Subject Consistency but falls behind on Temporal Flickering. These dimension-level insights are useful for identifying the dimensions where a given model has a high failure rate. This is insightful data for model builders to refine their datasets, prepare LoRAs, and in particular gain deep insight into how the latent space of the model is organized[5] (It would be interesting to formally describe the shape of the latent space of each model, which can provide insight into how a video model really understands features.).
Validation
It is important to run statistical tests to ensure that the VLM evaluator produces stable results, so we run the same evaluation multiple times and measure question-level correlation between runs. We track Pearson correlation, exact match rate, and within-plus-minus-one agreement rate across all models and dimensions. Questions that show consistently low correlation across multiple run pairs are flagged as unreliable and become candidates for revision or removal.
| Model | r | Exact Match | Within ±1 |
|---|---|---|---|
| Wan 2.2 14B | 0.924 | 87.4% | 99.5% |
| LTX2 19B | 0.902 | 82.7% | 99.2% |
| Veo 3.1 | 0.886 | 79.5% | 99.5% |
| Kling 2.6 Pro | 0.876 | 81.7% | 98.8% |
With very high correlation and within-plus-minus-one agreement above 98%, the evaluator almost never disagrees with itself by more than one point. The evaluator may rarely hesitate between a 4 and a 5, but almost never between a 4 and a 2, which gives us a lot of confidence in its evaluation.
Human Alignment
We are conducting a survey to collect human Likert ratings on a subset of videos and prompts using an internal tool we developed. We will integrate this tool into WorldJen in an upcoming version. These human ratings will be compared against evaluator scores to measure correlation and identify dimensions where automated evaluation diverges most from human judgment.
Final Remarks
WorldJen is obsessed with reducing costs of video generation and producing reliable benchmarks for our customers. In the first version of the product we defined our overall goal, and set up a framework which will:
- Allow users to upload their model checkpoints
- Generate videos
- Analyze videos and produce benchmarking reports
in an automated way.
Our work stands out from VBench in the fact that our curated prompt dataset is focused on:
- Human generated prompts, enhanced with LLMs, represent realistic queries for video generations
- Multiple dimension coverage, reducing video generation and capturing user query complexity
- Automated flexible sampling of prompts, depending on user preference of dimension, while minimizing the number of videos needed for the score
Our VLM questionnaire is focused on:
- Prompt specific, dimension specific questionnaire. For each prompt, questions target dimension specific features we expect to appear in a video or potential flaws that can appear to highlight failure.
- Likert scale scoring for the VLM with a 5 point scoring rubric for each benchmarking dimension.
- Statistical reliability tests to improve reliability
Ready to benchmark your model?
Try WorldJen at worldjen.com, or reach out to us to learn more.